What Is A Good Inventory Turnover Ratio? Explanation & Formula
Your inventory turnover ratio is one of the clearest signals of how healthy your stock and your cash flow really are. It tells you how many times you sold through and replaced your goods over a set period, usually a year.
At jam-n, we've watched millions of orders move through our California warehouses, so we know a thing or two about what fast, accurate stock movement looks like. So what counts as a "good" number, how do you find it, and when is faster actually too fast? Let's break it down.
TL;DR
Inventory Turnover Ratio measures how often you sell and restock inventory, calculated as COGS ÷ average inventory.
A "good" ratio is industry-specific. Many businesses aim for 4-6, while 5-10 is healthy across most sectors.
Higher usually means strong sales and lean stock, but too high can spell stockouts and lost orders.
Lower points to overstocking or slow sales, tying up cash and warehouse space.
Context beats the raw figure; compare against your industry, history, and product mix.
What Is The Inventory Turnover Ratio?
The inventory turnover ratio, sometimes also called stock turnover rate, is an efficiency metric that shows how many times a business sells and replaces its entire inventory during a specific window of time. It's a favorite of finance teams, operators, and lenders because it links three things at once: sales, stock levels, and the cash locked up in your shelves.
So, what does inventory turnover ratio tell you? In plain terms, the rate of inventory turnover reveals how quickly products move from your shelves to your customers. A brisk pace generally means demand is healthy and you're not sitting on dead stock. A sluggish pace can flag overstocking, weak sales, or forecasting that's drifted out of step with reality.
The Inventory Turnover Formula
The inventory turnover formula is refreshingly simple. No spreadsheets full of macros required:
➡️ Inventory Turnover Ratio = Cost of Goods Sold (COGS) ÷ Average Inventory
Where average inventory is the sum of your beginning and ending inventory for the period, divided by two. COGS sits on your income statement, while average inventory comes off the balance sheet, so both numbers are already available in your books.
📌 Some teams divide net sales by average inventory instead of COGS. It works, but it mixes the selling price into the math. COGS is the cleaner, industry-standard choice for benchmarking against other companies.
How To Calculate Inventory Turnover
Wondering how to find inventory turnover ratio in practice? Here's how to calculate inventory turnover in four steps:
Pull your COGS for the period. Let’s say, one fiscal year.
Find average inventory by adding beginning and ending inventory, then dividing by two.
Divide COGS by average inventory to get your turnover ratio.
Convert to days if you like, by dividing 365 by the ratio (your "days sales of inventory").
Inventory Turnover Calculation Example
Say your COGS for the year was $1,200,000. You started with $180,000 in inventory and ended with $220,000, for an average of $200,000. Your ratio is $1,200,000 ÷ $200,000 = 6. That means you sold and replaced your stock roughly six times – about every 61 days. That's a tidy result for many consumer-goods brands.
What Is A Good Inventory Turnover Ratio?
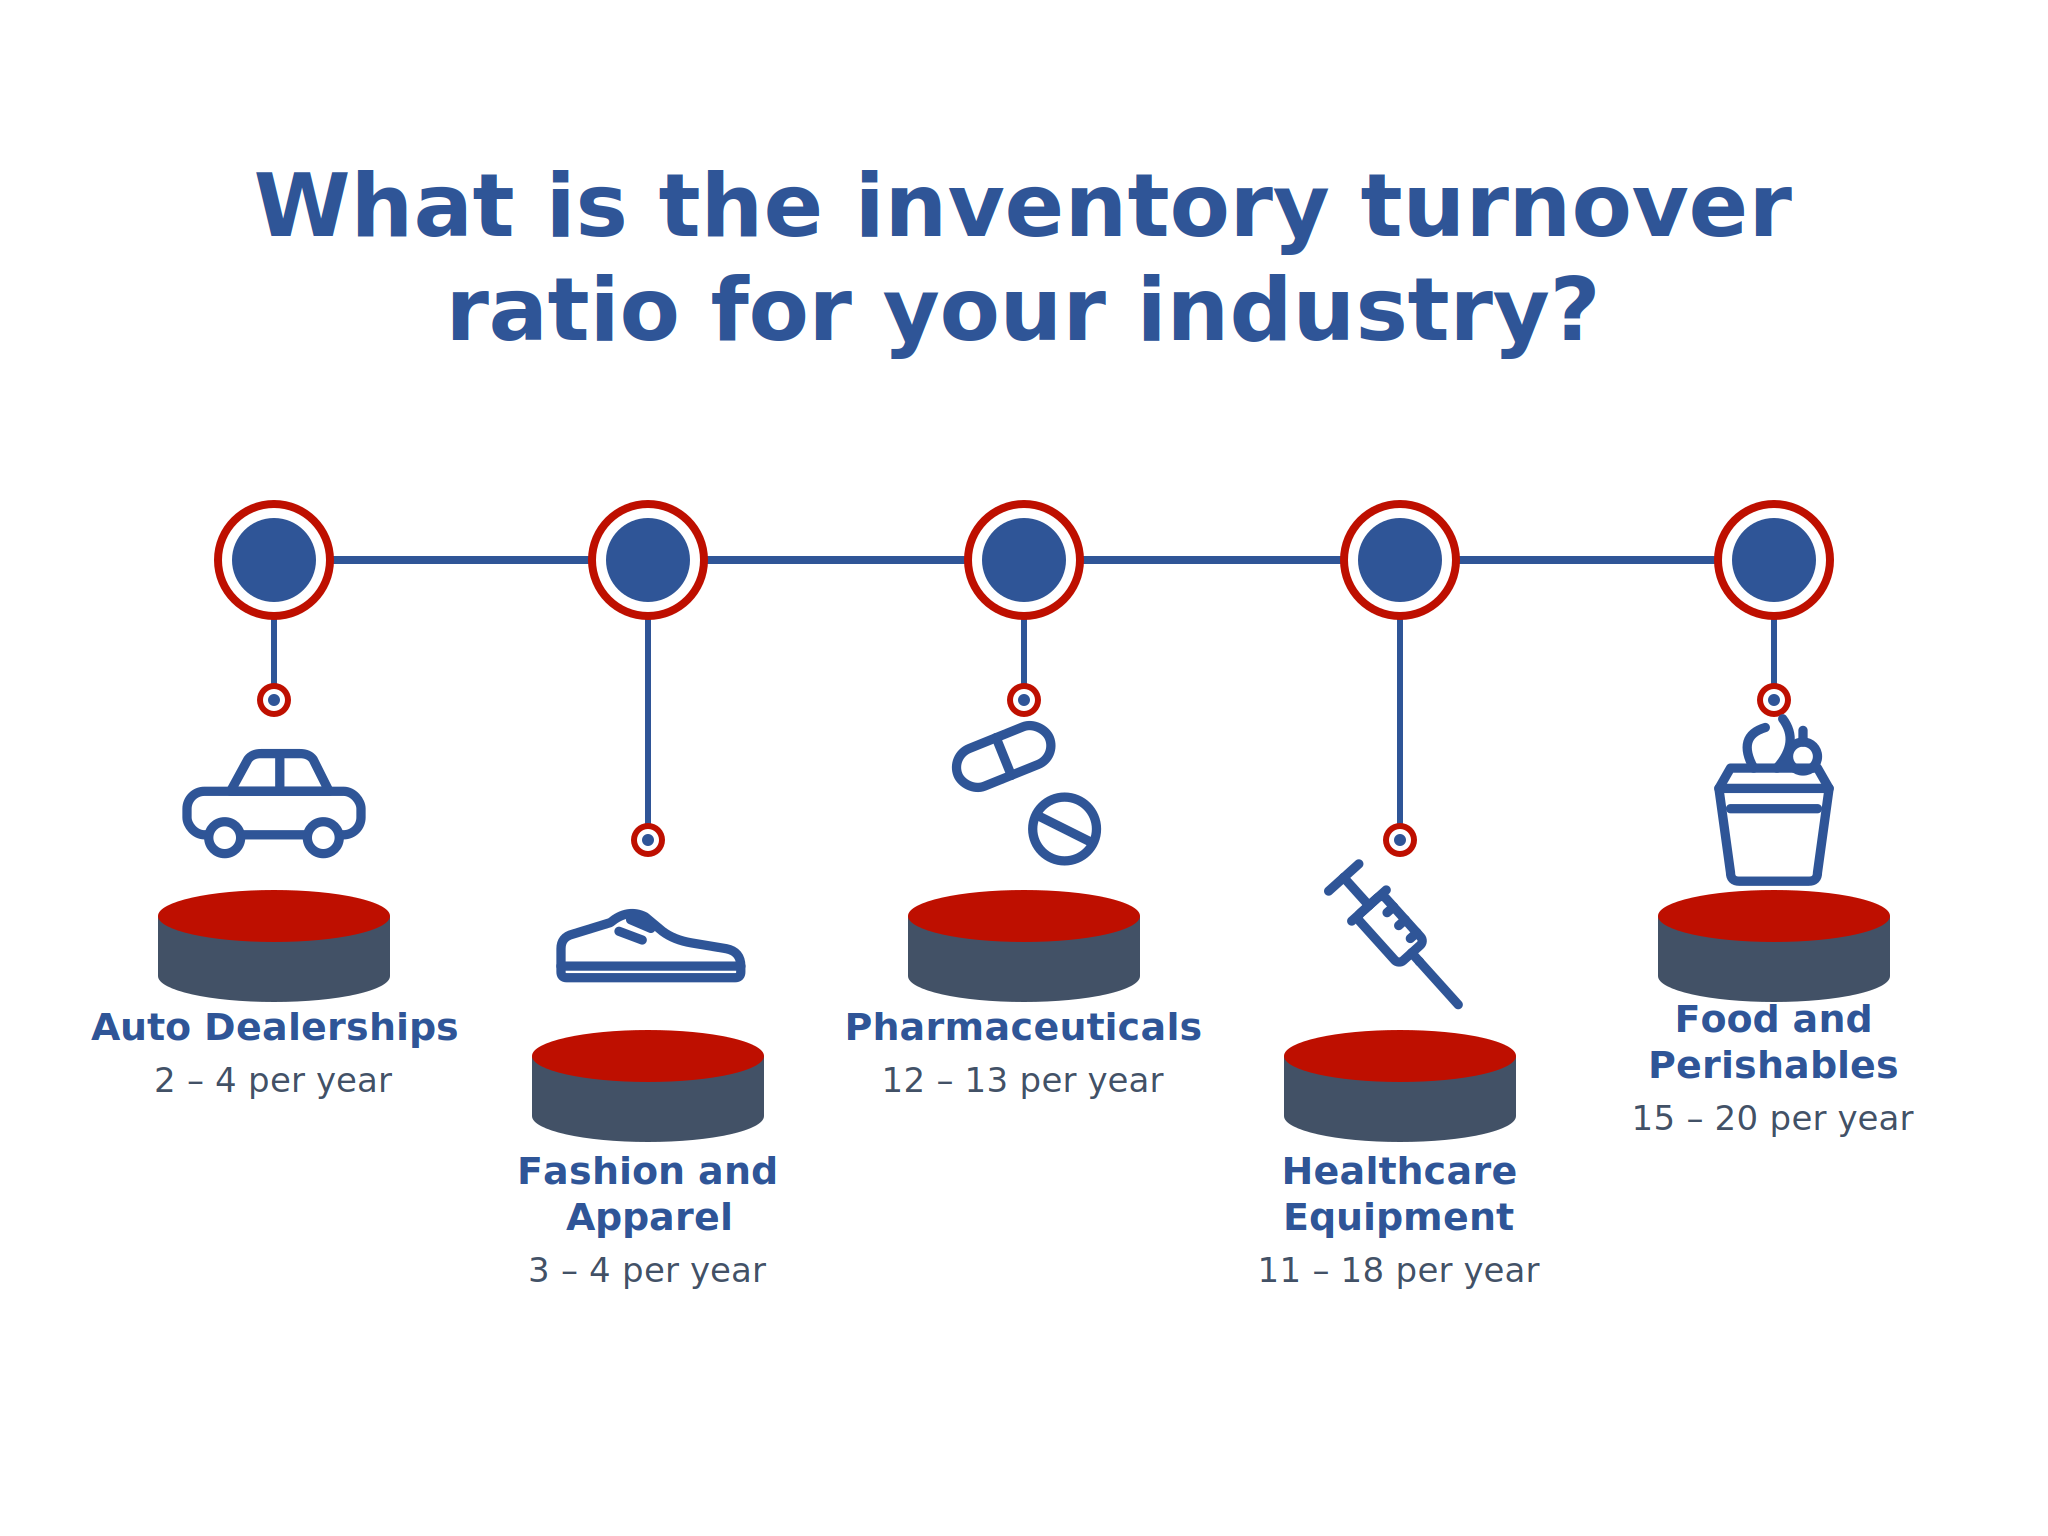
So, what inventory turnover ratio should you aim for? It depends on your products, margins, and sales cycle. A good inventory turnover ratio typically lands between 4 and 6 for many businesses, with 5-10 considered healthy across most industries. Grocery and perishable goods turn far faster; furniture, machinery, and big-ticket items turn much slower. And that's perfectly normal.
For real-world context, the total business inventories-to-sales ratio in the U.S. sat at 1.32 in early 2026, which works out to roughly nine inventory turns a year economy-wide.
Still, context is everything. A strong inventory turnover analysis compares your numbers to those of your peers and your own history, not to a one-size-fits-all target. Smart inventory management starts with knowing your baseline.
What A High Or Low Ratio Tells You
A quick side-by-side helps interpret what your number is really saying:
| Signal | Likely Meaning | Watch Out For |
|---|---|---|
| High Ratio | Strong sales, lean stock, low holding costs | Possible stockouts & missed orders if it climbs too far |
| Low Ratio | Slow sales, overstocking, capital tied up | Obsolescence and crowded warehouse space |
| Steady Ratio | Stable demand and disciplined ordering | Complacency; keep benchmarking as markets shift |
A high inventory turnover ratio is usually something to celebrate. But a ratio that keeps climbing can quietly mean you're not holding enough product to meet demand. Both extremes cost money, just in different ways, which is where accurate demand forecasting and regular stock counts help you keep fulfillment lean, efficient, and ready for what’s next.
Is A Higher Inventory Turnover Ratio Better?
Is a higher inventory turnover ratio better? Well, generally, yes, but up to a point. Faster turns mean less cash frozen in stock and lower storage costs. But push the ratio too high and you risk understocking, leaving shelves empty when a sales spike hits.
💡 The sweet spot is enough stock to keep orders flowing without warehouses bursting at the seams. That balance gets a lot easier with real-time visibility and smart inventory placement, the foundation of solid ecommerce warehousing and retail distribution.
Keep Your Inventory Turnover Ratio Healthy With jam-n
Inventory turnover may show up in the finance report, but it starts on the warehouse floor: receiving done right, counts kept clean, and shipments moving on schedule. With 30+ years in logistics and real-time inventory visibility through our omnichannel fulfillment and value-added services, jam-n helps brands keep and handle stock better.
Whether you're balancing B2B orders or scaling DTC volumes, we'll help you store, pick, pack, and ship with fewer surprises and tighter day-to-day execution.
Frequently Asked Questions
What Is A Good Inventory Turnover Ratio For A Small Business?
There's no universal figure, but many small businesses target 4 to 6 turns a year. Compare your ratio with others in your industry and with your own past performance to gain a meaningful interpretation.
What Does Inventory Turnover Ratio Tell You?
Inventory turnover ratio tells you how quickly stock sells and gets replaced, helping you spot slow movers and fulfillment gaps.
How Is Inventory Turnover Calculated? (A Quick Example Of Inventory Turnover)
Divide COGS by average inventory. If your COGS is $500,000 and the average inventory is $125,000, your ratio is 4, meaning you sold and replaced your stock four times during the period.
Can An Inventory Turnover Ratio Be Too High?
Yes. A very high ratio can mean you're selling well but understocking, leading to stockouts, rushed reorders, and missed sales. The goal is fast movement, balanced with enough inventory to meet demand.
Is Inventory Turnover The Same As Stock Turnover?
They're the same metric under different names. "Stock turnover" is common in the UK and retail; "inventory turnover ratio" is the standard U.S. accounting term. Both measure how often inventory cycles.
Follow: @jamnlogistics